Figure 1.
Sketch map of the Ponta Grossa Arch Alkaline Province. Alkaline complexes: Bairro da Cruz (BC), Barra do Itapirapuã (BIT), Banhadão (BN), Barra do Teixeira (BT), Cananéia (CN), Ipanema (IP), Itapirapuã (IT), Jacupiranga (JC), José Fernandes (JF), Juquiá (JQ), Mato Preto (MP), Pariquera-Açu (PAR), Piedade (PI), and Tunas (TU). States: São Paulo (SP), Paraná (PR), and Santa Catarina (SC).
Figure 2.
(A) Localization map of study area within airborne geophysical survey and geological maps used in this work. (B) Simplified geological map for the study area based on Cerro Azul (
Brumatti and Almeida 2014) and Apiaí (
Morais et al. 2012) maps. Alkaline complexes: Bairro da Cruz (BC), Barra do Itapirapuã (BIT), Banhadão (BN), Barra do Teixeira (BT), Itapirapuã (IT), José Fernandes (JF), Mato Preto (MP), and Tunas (TU).
Figure 3.
(A) TMA map data from study area and (B) its reduction to the pole. (A) Thick white and (B) black lines represent the alkaline complexes: Bairro da Cruz (BC), Barra do Itapirapuã (BIT), Banhadão (BN), Barra do Teixeira (BT), Itapirapuã (IT), José Fernandes (JF), Mato Preto (MP), and Tunas (TU).
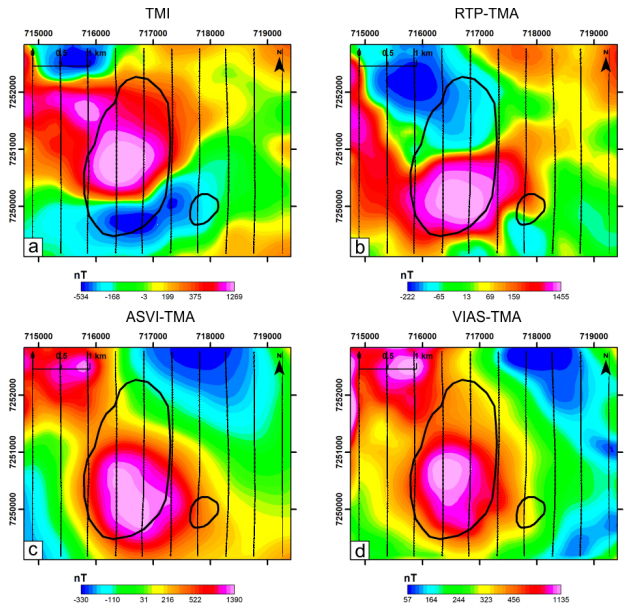
Figure 4.
Magnetic responses of Bairro da Cruz Complex (black polygons): (A) Total magnetic anomaly (TMA), (B) TMA reduced-to-pole (RTP-TMA), (C) Analytic signal of the vertical integral of TMA (ASVI-TMA), (D) Vertical integral of the analytic signal of TMA (VIAS-TMA). N-S oriented black lines are the airborne survey flight lines.
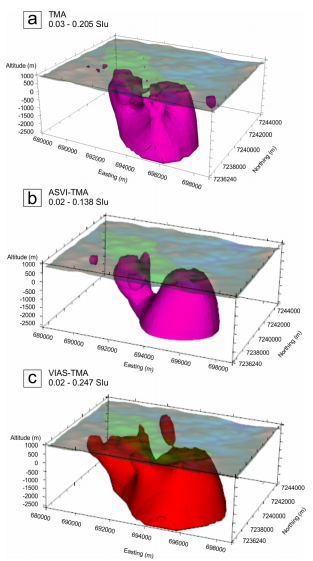
Figure 5.
Contrast of apparent magnetic susceptibility distribution in 3D models for each type of Bairro da Cruz gridded data described in
Figure 4 (except for the RTP-TMA grid). Models were cut in an arbitrary threshold value (displayed on the image) to create a better representation of the surface geology. Minimum values for each model: -0.111 (TMA), -0.046 (ASVI-TMA), and -0.058 SIu (VIAS-TMA). The maximum values of magnetic susceptibility were not modified. Altitudes are GPS altitudes and zero values correspond to the Mean Sea Level (MSL). The blue and brown colored grid over the top represents the Digital Terrain Model (DTM) for the area, which ranges from 795 to 279 m. The green polygon in this grid represents the Bairro da Cruz geologic surface boundaries.
Figure 6.
Magnetic responses of José Fernandes Gabbro (black polygon): (A) Total magnetic anomaly (TMA), (B) TMA reduced-to-pole (RTP-TMA), (C) Analytic signal of the vertical integral of TMA (ASVI-TMA) and (D) Vertical integral of the analytic signal of TMA (VIAS-TMA). N-S oriented black lines are the airborne survey flight lines.
Figure 7.
Contrast of apparent magnetic susceptibility distribution in 3D models for each type of José Fernandes gridded data described in
Figure 6 (except for the RTP-TMA grid). Models were cut in an arbitrary threshold value (displayed on the image) to create a better representation of the surface geology. Minimum values for each model: -0.108 (TMA), -0.039 (ASVI-TMA), and -0.074 SIu (VIAS-TMA). The maximum values of magnetic susceptibility were not modified. Altitudes are GPS altitudes and zero values correspond to the Mean Sea Level (MSL). The blue and brown colored grid over the top represents the Digital Terrain Model (DTM) for the area, which ranges from 717 to 320 m. The green polygon in this grid represents the José Fernandes Gabbro geologic surface boundaries..
Figure 8.
Magnetic responses of Tunas Complex (black polygon): (A) total magnetic anomaly (TMA), (B) TMA reduced-to-pole (RTP-TMA), (C) Analytic signal of the vertical integral of TMA (ASVI-TMA) and (D) Vertical integral of the analytic signal of TMA (VIAS-TMA). N-S oriented black lines are the airborne survey flight lines.
Figure 9.
Contrast of apparent magnetic susceptibility distribution in 3D models for each type of Tunas Complex gridded data described in
Figure 8 (except for the RTP-TMA grid). Models were cut in an arbitrary threshold value (displayed on the image) to create a better representation with of surface geology. Minimum values for each model: -0.088 (TMA), -0.05 (ASVI-TMA), and -0.079 SIu (VIAS-TMA). The maximum values of magnetic susceptibility were not modified. Altitudes are GPS altitudes and zero values correspond to the Mean Sea Level (MSL). The blue and brown colored grid over the top represents the Digital Terrain Model (DTM) for the area, which ranges from 1,049 to 681 m. The green polygon in this grid represents the Tunas Complex geologic surface boundaries.
Figure 10.
Box-and-whisker plots of radiometric data from the airborne geophysical survey. IQR stands for interquartile range. Alkaline complexes: Bairro da Cruz (BC), Barra do Itapirapuã (BIT), Banhadão (BN), Barra do Teixeira (BT), Itapirapuã (IT), José Fernandes (JF), Mato Preto (MP), and Tunas (TU). Note that the eU and eTh plots have a scale break to improve readability since there are large differences between the high and low values of the data.
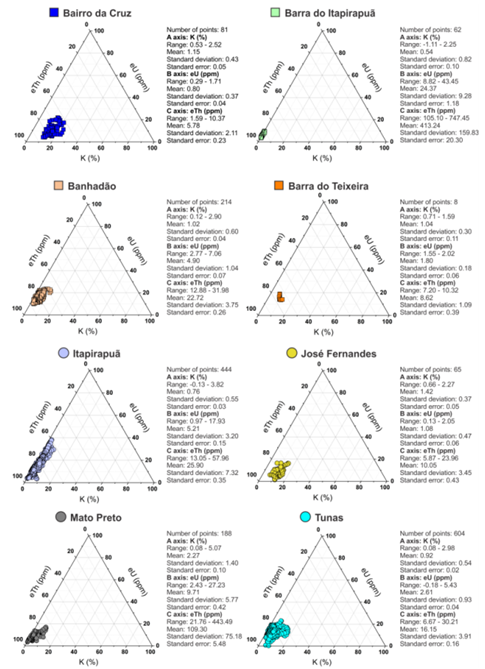
Figure 11.
Relative radioelement concentrations for each intrusion displayed in ternary diagrams. Data points are sampled data from the airborne survey.
Figure 12.
Flight line L12845:915 profile for radioelements (K, eTh, and eU) and magnetic data (TMA, RTP-TMA) alongside DTM values from Bairro da Cruz Complex.
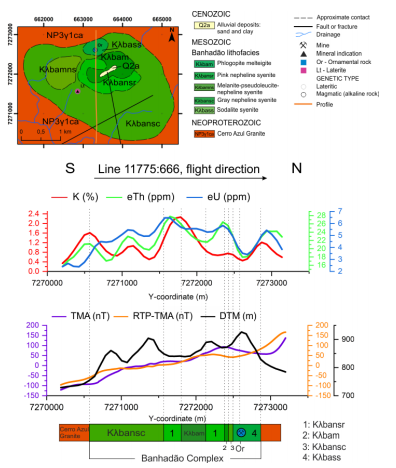
Figure 13.
Flight line L11775:666 profile for radioelements (K, eTh, and eU) and magnetic data (TMA, RTP-TMA) alongside DTM values from Banhadão Complex.
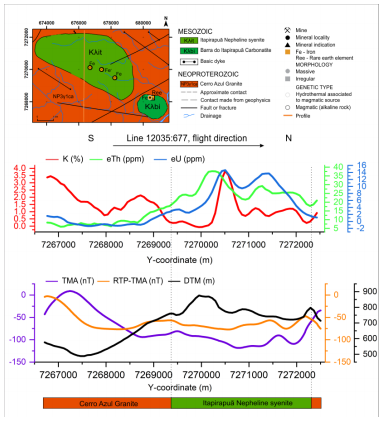
Figure 14.
Flight line L12035:677 profile for radioelements (K, eTh, and eU) and magnetic data (TMA, RTP-TMA) alongside DTM values from Itapirapuã Nepheline syenite.
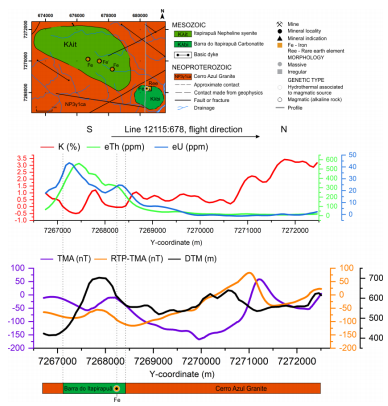
Figure 15.
Flight line L12115:678 profile for radioelements (K, eTh, and eU) and magnetic data (TMA, RTP-TMA) alongside DTM values from Barra do Itapirapuã Carbonatite.
Figure 16.
Flight line L11696:663 profile for radioelements (K, eTh, and eU) and magnetic data (TMA, RTP-TMA) alongside DTM values from Barra do Teixeira Phonolite.
Figure 17.
Flight line L12595:697 profile for radioelements (K, eTh, and eU) and magnetic data (TMA, RTP-TMA) alongside DTM values from José Fernandes Gabbro.
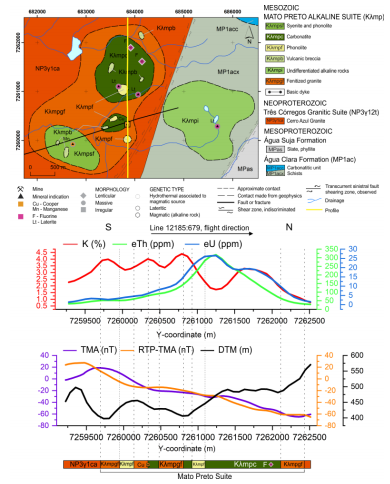
Figure 18.
Flight line L12185:679 profile for radioelements (K, eTh, and eU) and magnetic data (TMA, RTP-TMA) alongside DTM values from Mato Preto Complex.
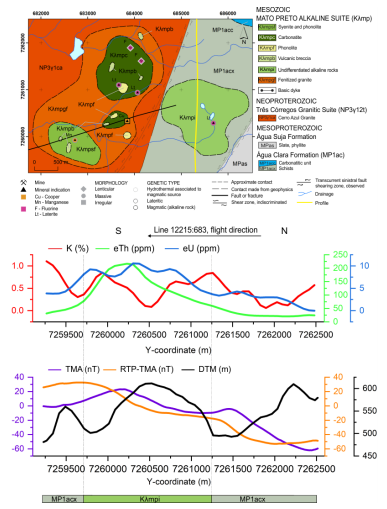
Figure 19.
Flight line L12215:683 profile for radioelements (K, eTh, and eU) and magnetic data (TMA, RTP-TMA) alongside DTM values from Mato Preto Complex.
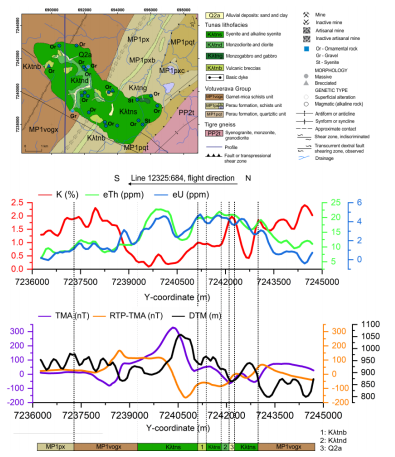
Figure 20.
Flight line L12325:684 profile for radioelements (K, eTh, and eU) and magnetic data (TMA, RTP-TMA) alongside DTM values from Tunas Complex.
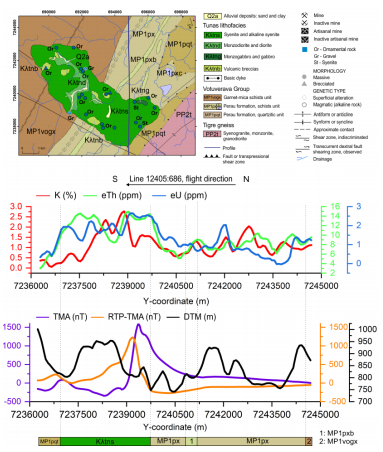
Figure 21.
Flight line L12405:686 profile for radioelements (K, eTh, and eU) and magnetic data (TMA, RTP-TMA) alongside DTM values from Tunas Complex.
Table 1.
Summary of the main characteristics of the igneous rocks in the study area.
Table 2.
Parameters used for the reduction to the pole for the study area and inverse modeled igneous rocks in this study.
Table 3.
Gamma-ray spectrometric and magnetic responses of igneous rocks in the study area. The blue stands for relatively low values while yellow and red are for medium and high values, respectively. The letter D in the TMA row represents that the body showed a dipole anomaly response. Igneous rocks: Bairro da Cruz (BC), Barra do Itapirapuã (BIT), Banhadão (BN), Barra do Teixeira (BT), Itapirapuã (IT), José Fernandes (JF), Mato Preto (MP), and Tunas (TU).

 Thumbnail
 Thumbnail
 Thumbnail
 Thumbnail
 Thumbnail
 Thumbnail
 Thumbnail
 Thumbnail
 Thumbnail
 Thumbnail
 Thumbnail
 Thumbnail
 Thumbnail
 Thumbnail
 Thumbnail
 Thumbnail
 Thumbnail
 Thumbnail
 Thumbnail
 Thumbnail
 Thumbnail
 Source: modified from